Summary: Google has retired the standalone Core Web Vitals dashboard, pushing professionals towards a more integrated and accurate page experience monitoring strategy. This article deconstructs the shift, explains the superior Interaction to Next Paint (INP) metric replacing First Input Delay (FID), and outlines the modern toolkit—including the main Core Web Vitals report in Google Search Console, PageSpeed Insights, and the CrUX History API—that high-performing teams must now master. This evolution requires a cultural change, transforming performance optimization from a siloed task into a continuous, collaborative effort between SEOs and developers.
The sudden disappearance of the Chrome UX (CrUX) Dashboard from Looker Studio sent a ripple of concern through the SEO community. Was this a sign that Google is deprioritizing page experience? The answer is a definitive no. Instead, it signals the maturation of web performance analysis. Google’s retirement of a familiar tool isn’t a step back; it’s a forceful nudge forward, away from a single, flawed report and toward a more holistic, continuous, and integrated monitoring ecosystem. The era of chasing a single dashboard score is over. The era of genuine, user-centric performance optimization has begun.
The Real Reason the CrUX Dashboard Was Retired
Let’s be direct: the old CrUX Dashboard, built on Looker Studio (formerly Data Studio), was a problematic and unscalable tool. Its retirement wasn’t about hiding data; it was about abandoning a broken delivery mechanism. Many seasoned professionals can recall the frequent outages, data delays, and reliability issues that plagued the dashboard. It often provided a snapshot of the past that was too little, too late.
Google’s strategy is a move toward more robust, direct, and granular data sources. The old dashboard was an intermediary that often failed. The replacement is direct access to the source. Tools like the CrUX History API and the user-friendly CrUX Vis interface provide more timely, reliable, and detailed information. This transition empowers developers and SEOs to query historical performance data directly, identifying trends and pinpointing the exact moment a metric began to degrade without waiting for a monthly report to refresh.
Meet INP: The New Standard for User Interaction
Concurrent with the dashboard’s retirement is a significant upgrade in how we measure responsiveness. First Input Delay (FID) is officially gone, replaced by Interaction to Next Paint (INP). This is not a simple rebranding; it is a fundamental improvement in measuring user experience.
FID measured only the delay before the first interaction a user had with a page. This was a limited metric. It ignored the lag a user might feel when clicking a menu, submitting a form, or opening an accordion after that initial interaction.
Interaction to Next Paint (INP), on the other hand, is a far more comprehensive measure. It assesses the latency of all interactions throughout a user’s visit, reporting the one that took the longest. This metric more accurately reflects the real-world frustration of a sluggish interface. A low INP score indicates that a page is consistently responsive, from the moment it loads until the user leaves. This makes page experience optimization less about passing a technical test and more about delivering a fluid, frustration-free journey. The INP vs FID debate is settled: INP is the superior metric for quantifying perceived performance.
Your New Core Web Vitals Report Toolkit
Relying on one dashboard was always a fragile strategy. The modern workflow for performance monitoring is a multi-layered approach, using a suite of integrated tools for different stages of analysis. High-performing teams are building their process around this new toolkit.
Your workflow should now incorporate:
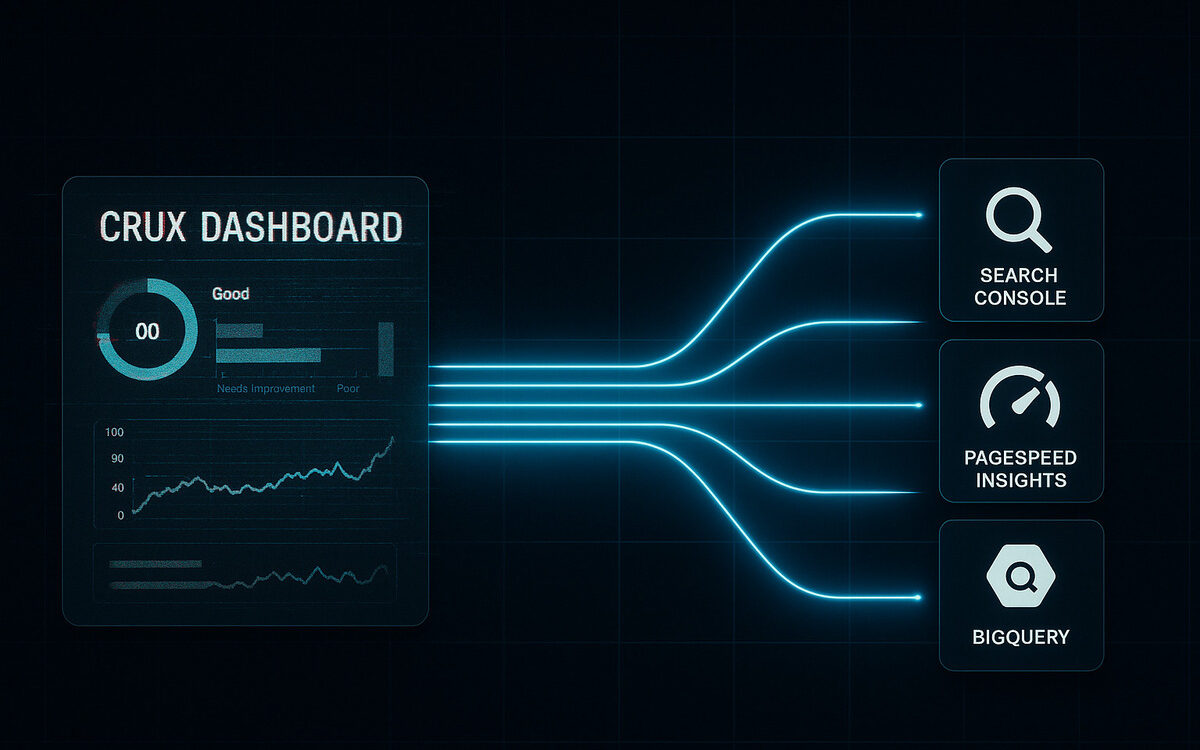
- Google Search Console: The main Core Web Vitals report within GSC remains your high-level dashboard. Use it for broad monitoring to identify groups of URLs (e.g., “Poor” or “Needs Improvement”) that require attention. It’s your starting point, not your final destination.
- PageSpeed Insights (PSI): When GSC flags a URL group, PSI is your next stop. Use it for on-demand analysis of a specific URL. It provides both lab data (a controlled test) and field data (real-world CrUX numbers) to diagnose issues on a page-by-page basis.
- CrUX Report APIs & BigQuery: For deep, customized analysis, nothing beats querying the CrUX dataset directly. The CrUX History API and BigQuery allow you to track performance metrics over time, segment data by device or geography, and compare your site’s performance against competitors. This is where you move from reactive fixes to proactive strategy.
- Chrome DevTools: Once you’ve identified a problem with the tools above, DevTools is where you debug it. Its performance panel allows developers to simulate different network conditions and device types, identify render-blocking resources, and pinpoint the exact scripts or processes causing high INP.
This combination of tools provides a complete picture, from a 30,000-foot view in GSC down to the granular, line-by-line code analysis in DevTools.
A Cultural Shift: Page Performance is Now a Team Sport
This evolution in tooling forces a necessary cultural change. Page performance is no longer a “check-the-box” item that can be delegated solely to the SEO team. An SEO can identify a “Poor” URL group in the Core Web Vitals report, but they cannot rewrite the JavaScript causing the high INP.
The new ecosystem demands a collaborative, ongoing effort. Developers, SEOs, and marketers must be fluent in the same set of tools and speak the same language of performance. Success requires a continuous feedback loop:
- SEOs monitor GSC and CrUX data to identify performance regressions or opportunities.
- They collaborate with developers, using PSI and DevTools to pinpoint the root cause.
- Developers implement fixes and test them in a staging environment.
- The team monitors the CrUX data over the following weeks to validate that the fix improved real-world user experience.
Some professionals may feel that these Google Search Console updates make their lives harder by removing a simple dashboard. They might lament the need to learn new tools. This perspective views the change as an inconvenience, but it misses the larger point. Relying on the old, frequently delayed CrUX Dashboard provided a false sense of security. It encouraged a reactive posture to performance.
The new approach, while requiring a short-term learning adjustment, empowers us with more reliable, frequent, and powerful data. It encourages a proactive and accurate optimization practice. This leads to genuinely better user experiences, not just temporarily “passing” a static test.
It’s time to stop chasing a single “Good” score in a retired report. Audit your current performance monitoring toolkit today. Integrate the CrUX History API or CrUX Vis into your workflow, and prioritize optimizing for INP across your most critical user journeys. The tools are better, the data is cleaner, and the path to a faster web is clearer than ever.